1 Analytics and Strategy
This chapter will give some background on my ideologies around analytics and sports business at the club level. I also want to separate the disciplines of strategy and analytics. Analytics serves strategy, but the process derives from analytics. This chapter will outline my approach to analytics. There are often many ways to approach a problem, and some issues may not be worth solving for many reasons. Despite some inherent difficulties with sports, an analytic approach to problem-solving should always be at the core of your business strategy.
Analytics is about reconciling opportunities. Many of our problems are very old and still need to be solved. This statement is especially true for Operations. There are unlimited applications for analytics within any industry or business. Additionally, analytics can take many forms and could improve decision-making in many functions that we have already mentioned:
- Marketing: marketing mix, brand strategy, content, CRM, brand positioning, and pricing
- Business Intelligence: descriptive and prescriptive reporting
- Finance: capital expenditure, forecasting, corporate finance
- Sales: lead scoring, sales strategy, customer journey mapping
- Sponsorship: asset valuation, asset creation
- Operations: ingress and egress, staffing, concessions
- Technology: supporting these systems
Analytics can even assist in tasks outside core business functions such as human resources. For instance, you can optimize staffing or compensation packages. Ad hoc analytic tasks typically involve nothing more than a simple spreadsheet that organizes the data. Techniques and applications are varied and may include techniques such as:
- Segmentation
- Simulation
- Statistics
- Optimization
- Cognitive science and behavioral economics
- Programming
- Designing experiments (DOE)
These lists could be endlessly long. Versatility is the hallmark of a strong analyst and strategist. You will find few books on general strategy. Strategy is an amalgam of knowledge focused on specific problems. People who are good at it understand the business at a fundamental level and understand how to structure problems to solve them intelligently. You are forging an alloy that will increase profitability while making your business more efficient and resilient.
1.1 Understanding our definition of strategy
Strategy is a complex term but can be distilled into having a plan. A strategy has a goal, and that goal can vary. Like most companies (especially public companies), driving firm valuations may be a goal. You typically drive higher valuation by increasing revenue or reinforcing a strategic moat. For example, in the streaming wars, Netflix, Disney, and others are racing to produce content. Content is their strategic moat because the technical problems have been solved while consumer behavior has shifted. They play in a highly competitive space and are in a dogfight with every other competitor.
People often describe strategy as turning everyone’s head in the right direction. I suppose that is a component of strategy. Strategy can be offensive or defensive and involve public relations or lobbying efforts. It can include manipulating supply and demand market forces or structuring media rights deals. You can divest from underperforming assets or create entirely new asset classes. You can hedge against risks by diversifying your approach or through partnerships. It might mean evaluating capabilities. Unfortunately, it’s a broad term that gets overused, is often confused for something else, and can become an abstraction if it isn’t framed around specific goals.
Strategy is also about communication. We must stress this statement. I suggest taking a negotiation course if you want to learn about strategy. You can also read some books that teach you how to talk to people. “How to win friends and influence people” (Carnegie 1981) is an excellent place to start. This classic self-improvement book was written in the nineteen-thirties and is as relevant today as it was then. Another great book you should consider is “Getting To Yes, Negotiating Agreement Without Giving In” (Roger Fisher 2011). This book is about positioning arguments, a critical skill set. If you can’t do it, you might as well not understand how addition works. Working with and understanding people, presentation skills, and understanding how to frame arguments without being condescending is critical to strategy. I can’t stress the importance of soft skills enough. Stop reading here if you have strong technical skill sets, and take an etiquette course to learn how to act and a rhetoric course to learn how to think. The liberal arts are under-appreciated in our field to the detriment of many practitioners.
From an academic standpoint, there are many strategic frameworks. Harvard’s Michael Porter described firms as “a collection of activities that are performed to design, produce, market, deliver, and support products.” (Keller 2003) Porter’s statement precisely describes what we are doing, but our product represents something more complex than a simple good or service. His most famous contribution to business strategy is likely “Porter’s five forces.” 5 What is interesting about this framework is that, on the surface, it doesn’t appear imminently valuable for a sports team. However, it is useful when considering strategic problems such as What Point-Of-Sale system should we use throughout our venue?. In that case, this model can evaluate whom you select based on those market forces. Will there be consolidation? What does that mean? What is our most powerful position in terms of negotiating? If the product is a commodity, the vendor must compete on price. Perhaps they are interested in marketing and are candidates for sponsorship. You could purchase the company. This is the classic strategy problem: “Build, Buy, or Lease.” You can get creative.
If you have ever messed around in the stock market, you’ll hear much talk about fundamentals. The type of analysis you might find on a trading platform is the illusion of analysis. Applying techniques like triple exponential smoothing6 or moving averages to stocks looks excellent, but it probably doesn’t matter. Does it make a novice a better trader? It might make them worse. An analysis is great if you understand it and is always contextual. It can be misleading or damaging if you need help understanding the context. Remember that data is not always the solution to every problem, and think critically about why a problem exists. The mechanical part of analysis isn’t the critical part of it. It should be a commodity. Focus on application and communication.
1.2 Technologies place in strategy and analytics
I consider the application of technology in analytics along five ordered dimensions. While you can jump around to a degree, each step is generally built on the stage below. As you ascend the steps, execution becomes more difficult and complex. Execution is where your strategy will fall apart. Read that last sentence again. Additionally, your system should flow from the top down. Keep your destination in mind as you move up each step.
As ridiculous as it may sound, you must begin with the data structure. You are building an engine, and you need to have all of the correct parts. Data is invariably messy. So much effort goes into cleaning, structuring, and storing data for use that it represents the bulk of time spent across the spectrum of analytics. It would be best if you began there.
Additionally, there are multiple levels of maturity on this front. For instance, ticketing data may be very well structured, while CRM data may be lacking. Therefore, I view analytics within the structure proposed in figure 1.1.
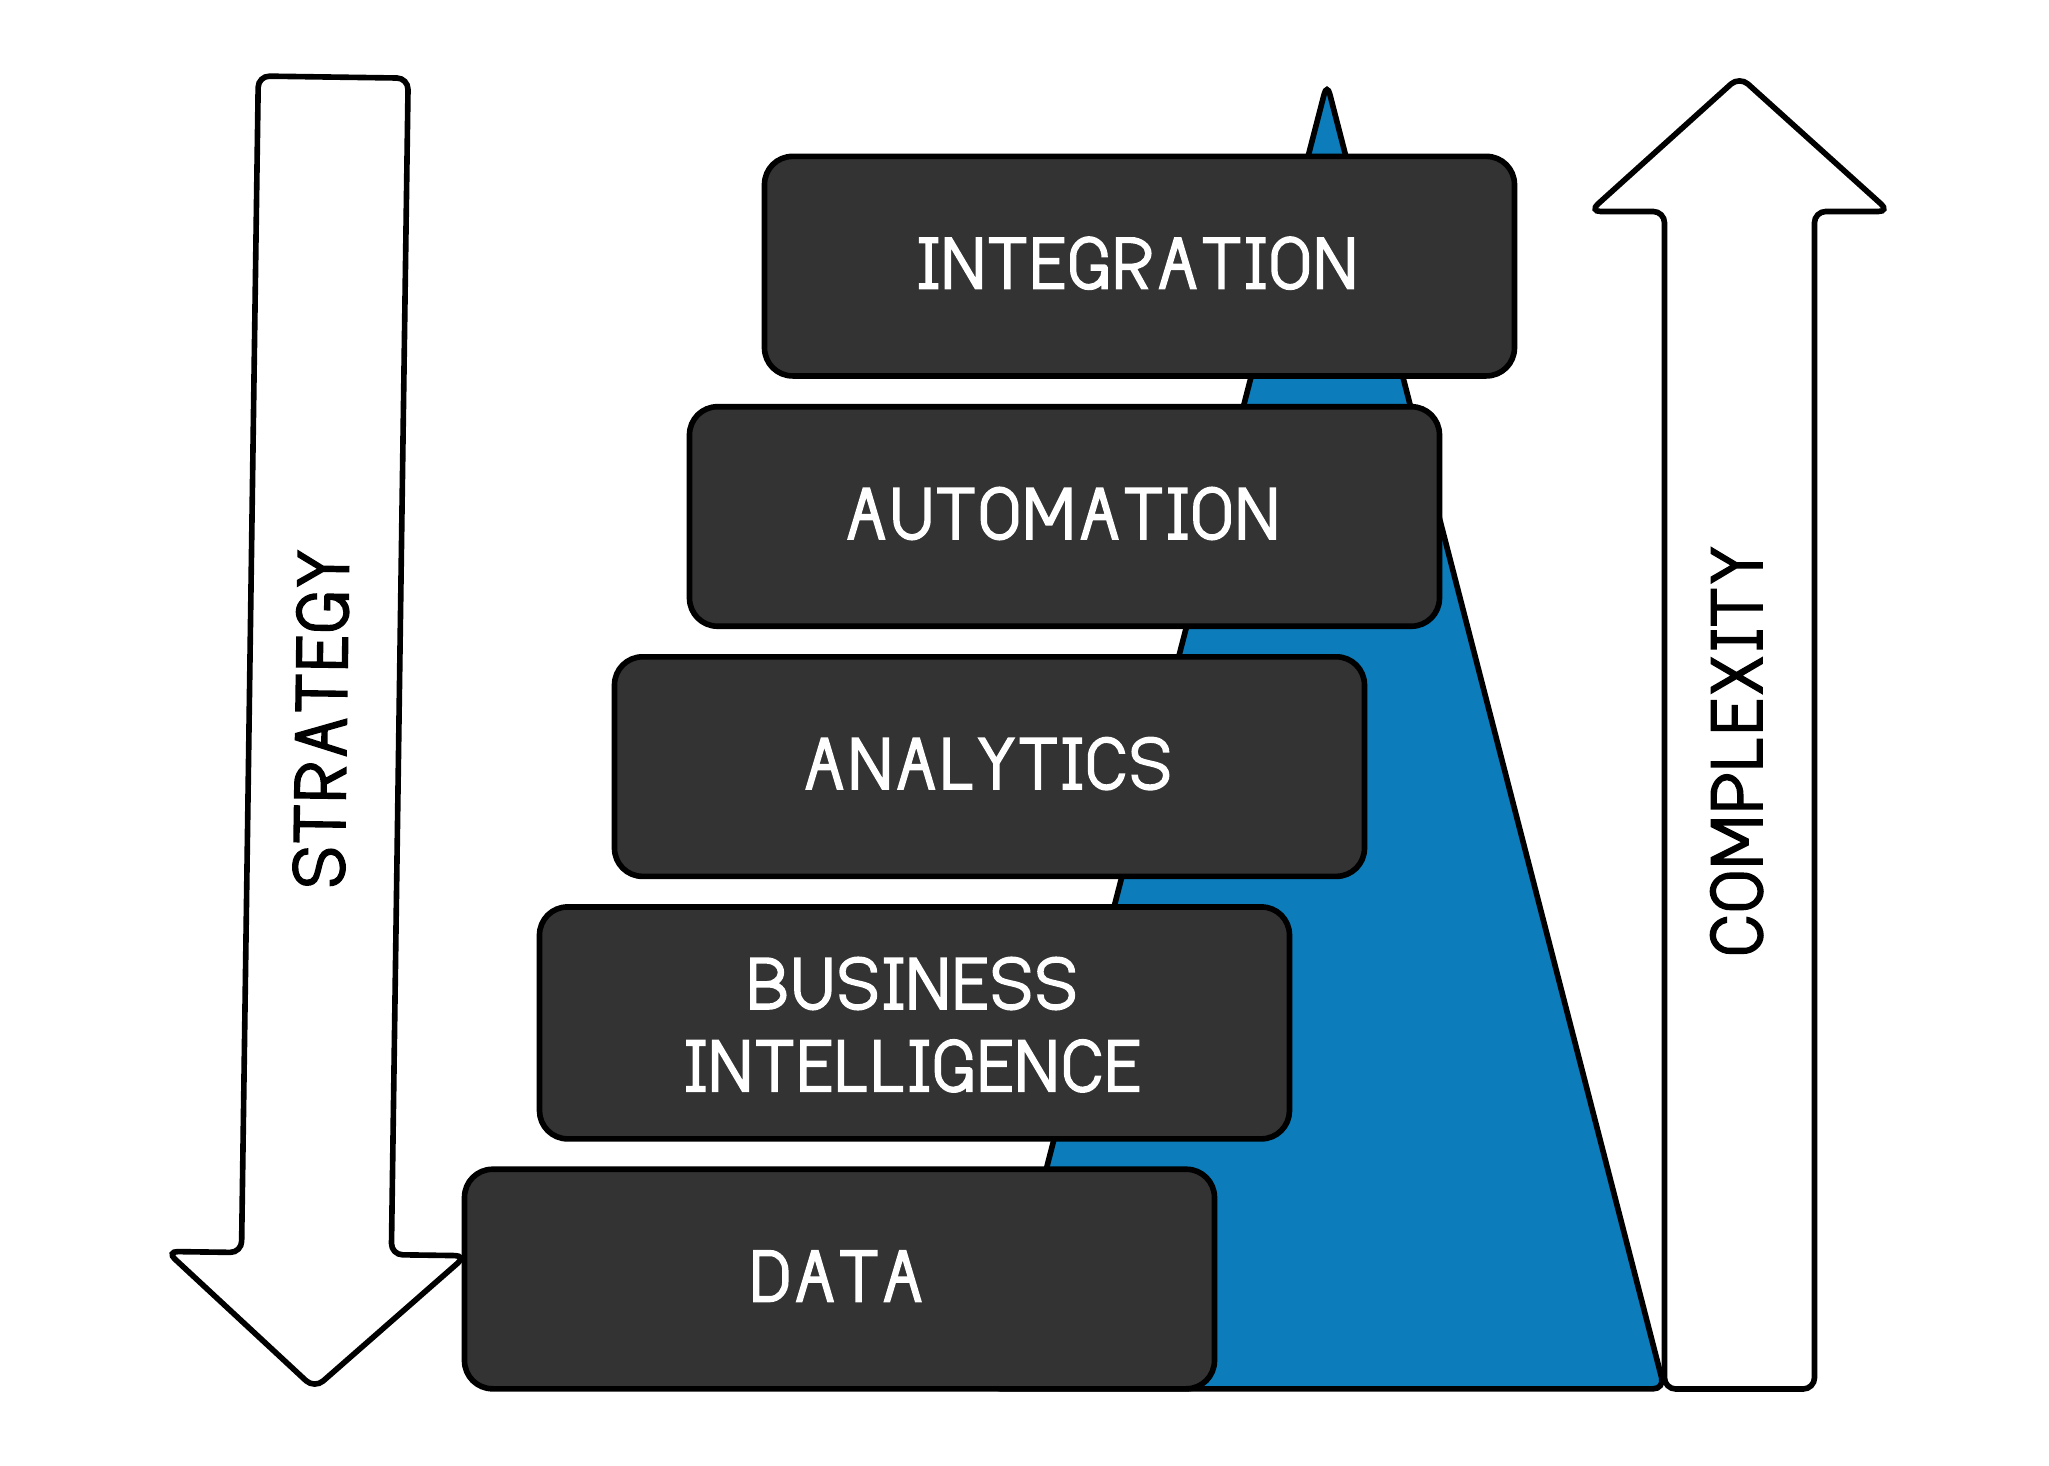
Figure 1.1: Data strategy heirarchy of needs
Furthermore, I consider technology a means to an end, not “an end unto itself. This needs to be clarified. Your technology strategy should flow from a well-articulated business strategy. You could spend capital to allow fans to enter a park leveraging facial recognition, but what problem does that solve? Is scanning a ticket the bottleneck in that system that slows the process? Do fans want it? Does the regulatory environment permit it? This sounds like a complex system more than a camera and a database. Focus on the system. Technology is the easy part to solve. While innovation is sometimes bred by throwing something at the wall to see if it sticks, I haven’t found that to be the primary vehicle for technology adoption. When an organization takes a misguided technology-first approach, I have found the results to be painfully unremarkable. Remember that some sports teams have made their brand focused on adopting technology. This contradicts what I just outlined and is valid if executed correctly. The same rule applies to both directions. Determine what you want to accomplish and why you want to achieve it before deploying a technology solution.
Perhaps you want to revolutionize your business. Few problems in business are solved in revolutionary ways. The internet feels much the same as it did twenty years ago. We are now talking about web 3.0 and the metaverse. We already have a metaverse. It is called the internet. It isn’t revolutionary. It represents a platform that big tech wants you to use to transact. It may be a better way of doing things or a worse way of doing everything. It could have tremendous advantages if you want to be an early mover, but you’ll take a risk. The jury will be out for the next decade on the metaverse. It may be 3D television. Remember those? Of course you don’t. Look for the business model that underlies these marketing schemes. Perhaps the metaverse is simply a way to help bolster augmented reality products. If you understand the mechanism, you can plan for what comes next and intelligently take risks.
We don’t want to be disparaging toward Information Technology. Strong I.T. skill sets are beneficial. As your skills progress, you’ll be exposed to a myriad of technologies:
- If you work on Windows or Apple, you’ll still need some understanding of Linux7
- Shell scripting is a critical skill for any dev-ops task8
- Start using git as a repository for your code9
- Tools such as docker allow you to package programs if you are doing web development10
- You don’t need a server. Google, Amazon, and Microsoft each have massive deployment platforms.
Be bold in spending the time to get familiar with these technology components. You’ll be rewarded and highly regarded for it.
The main difference between the internet today and twenty years ago is that people mostly use a phone to access and browse it. Incremental improvements over time are the way changes take place. Core business procedures can continuously be improved. Most rich people didn’t get there through some brilliant product or idea. They did the same things other rich people did, executed correctly, and were lucky. Think of analytics and business strategy in the same way. We’ll walk through each component in figure 1.1 and discuss it in more detail.
1.2.1 Data
Getting the foundational data elements in place is critical to all other hierarchy components. While we won’t discuss Master Data Management or specific technologies such as Customer Data Platforms, we will talk about the foundations of data and what we mean when we use the word. Most organizations have solved portions of their data management, but it’s a never-ending problem. There will always be newer and better systems, and there will always be a need to incorporate new data into your sales and marketing infrastructure. This process is accelerating as Google, Amazon, and others vie to own the cloud. Amazon Web Services and the Google Cloud Platform are disruptive because they can deliver capabilities that would be financially unfeasible for many firms trying to build them in-house. As a result, the on-prem DBMS will slowly go extinct11. This is also an old battle. If this was twenty-five years ago, our discussion might have been on Thin-client vs. Fat-Client computing. This discussion is fundamentally the same.
Let’s go ahead and make the assumption that your sports team needs to have their data in a better spot. Getting your data in a helpful position may take several varied techniques and has its considerations:
- What systems are the most important to incorporate?
- Is the data “Big,” meaning is it an engineering challenge to hold the data, or does its velocity necessitate a unique approach?
- How and where will it be housed?
- Who manages this process (internal, partner, etc.)?
- How much will this cost?
- Do we have the necessary skill sets to accomplish our goals?
- Who understands and manages the data structure?
Another important consideration is what you plan on doing with your data. How can it be used? This consideration could dictate your approach to making it available and how your ETL (Extract, Transform, and Load) procedures work. For instance, do you need your data to be available at all times, and does it need to be current? What does current mean? Latency may be insignificant. Indeed, it isn’t in most situations in sports. Twenty-four hours of latency is good enough.
On the other hand, many data points may only be considered at specific intervals. This gives you some indication of how to prioritize your tasks. Let’s illustrate the problem.
1.2.1.1 Understanding data structures
You’ll encounter numerous data structures working in sports, but none are more critical than the ticketing system. Regardless of the vendor (TicketMaster is probably the most common), you’ll encounter some form of the following ERD 1.2.
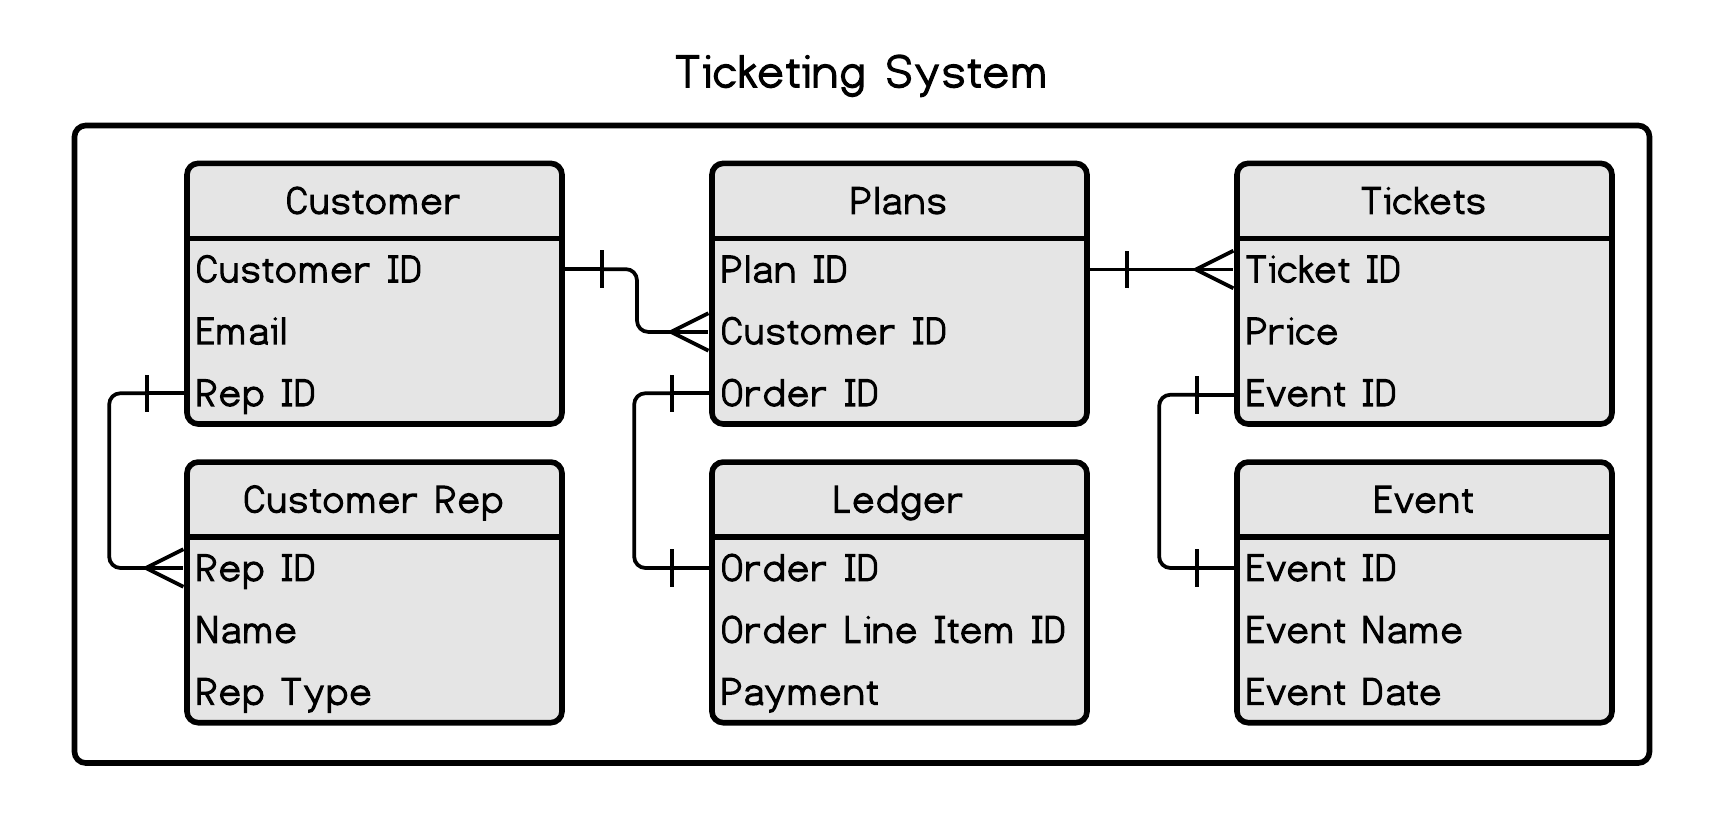
Figure 1.2: Ticketing system data structure
What are we looking at? While many different database systems 12 are available, the venerable relational database is the one you will encounter the most. AWS and Google have improved and optimized some of these models, but the basic concept will look familiar across most platforms. We’ll ignore even high-level discourse on the technical parts of database construction, such as cardinality and normal forms and discuss this stuff through examples.
Consider a database as a collection of excel workbooks formally linked with an I.D. column. We’ll call these workbooks tables. These tables will allow you to get information on transactions, historical purchase data, customer service rep data, ticketing information, and more. You can read the “crow’s foot” as “Many” and the cross as “one.” For example, one customer can have many plans. These relationships can be much more complicated, but at a basic level, the data you encounter will look like this. If the database is relational (More than likely), basic SQL statements can be used to retrieve your information:
------------------------------------------------------------------
-- SQL example
------------------------------------------------------------------
SELECT  A.customer_id
       ,A.email_addr
       ,B.plan_id
       ,B.price
FROM Customer A LEFT JOIN Plans B ON A.customer_id = B.customer_id
WHERE A.email_addr = "Ted.Williams@someserver.com"
The output from this query might look something like this:
| customer_id | email_addr | plan_id | price |
|---|---|---|---|
| 1940-2349-1243 | Ted.Williams@someserver.com | 23454 | 1094.00 |
| 1940-2349-1243 | Ted.Williams@someserver.com | 23455 | 3200.00 |
| 1959-9909-4567 | Ted.Williams@someserver.com | 61545 | 2500.00 |
For some reason, I fear typing SQL that isn’t in all caps. It isn’t case-sensitive, and it doesn’t matter. While the data will be more complex, this example demonstrates a basic table structure you will encounter. As you can see, it appears that Ted has multiple accounts. Duplication is the bane of the database engineer. It always confounds analysis in one way or another.
Let’s take a quick aside to discuss Structured Query Language, or SQL. SQL is the lingua-Franca of the database world. Although many technologies use “Not Only” SQL, you’ll get the most mileage from SQL, and it is a prerequisite if you want to work with data in almost any capacity. The good news is that learning at a basic level is relatively simple, and functional fluency can be achieved relatively easily. There are also plenty of free resources available to learn and practice it. W3 schools is an excellent one. 13
The integration between the CRM and ticketing systems is critical. Once again, this subject will give you multiple things to think about and discuss:
- How will the ETL be constructed? API, direct database connection, etc.
- How are parity checks considered?
These are all heavy I.T. tasks. Although the end product will be the most crucial component to an analyst, understanding how some of this stuff works is important. It will make you better. Practice SQL; you don’t have a choice if you want to be good and analysis in a business setting.
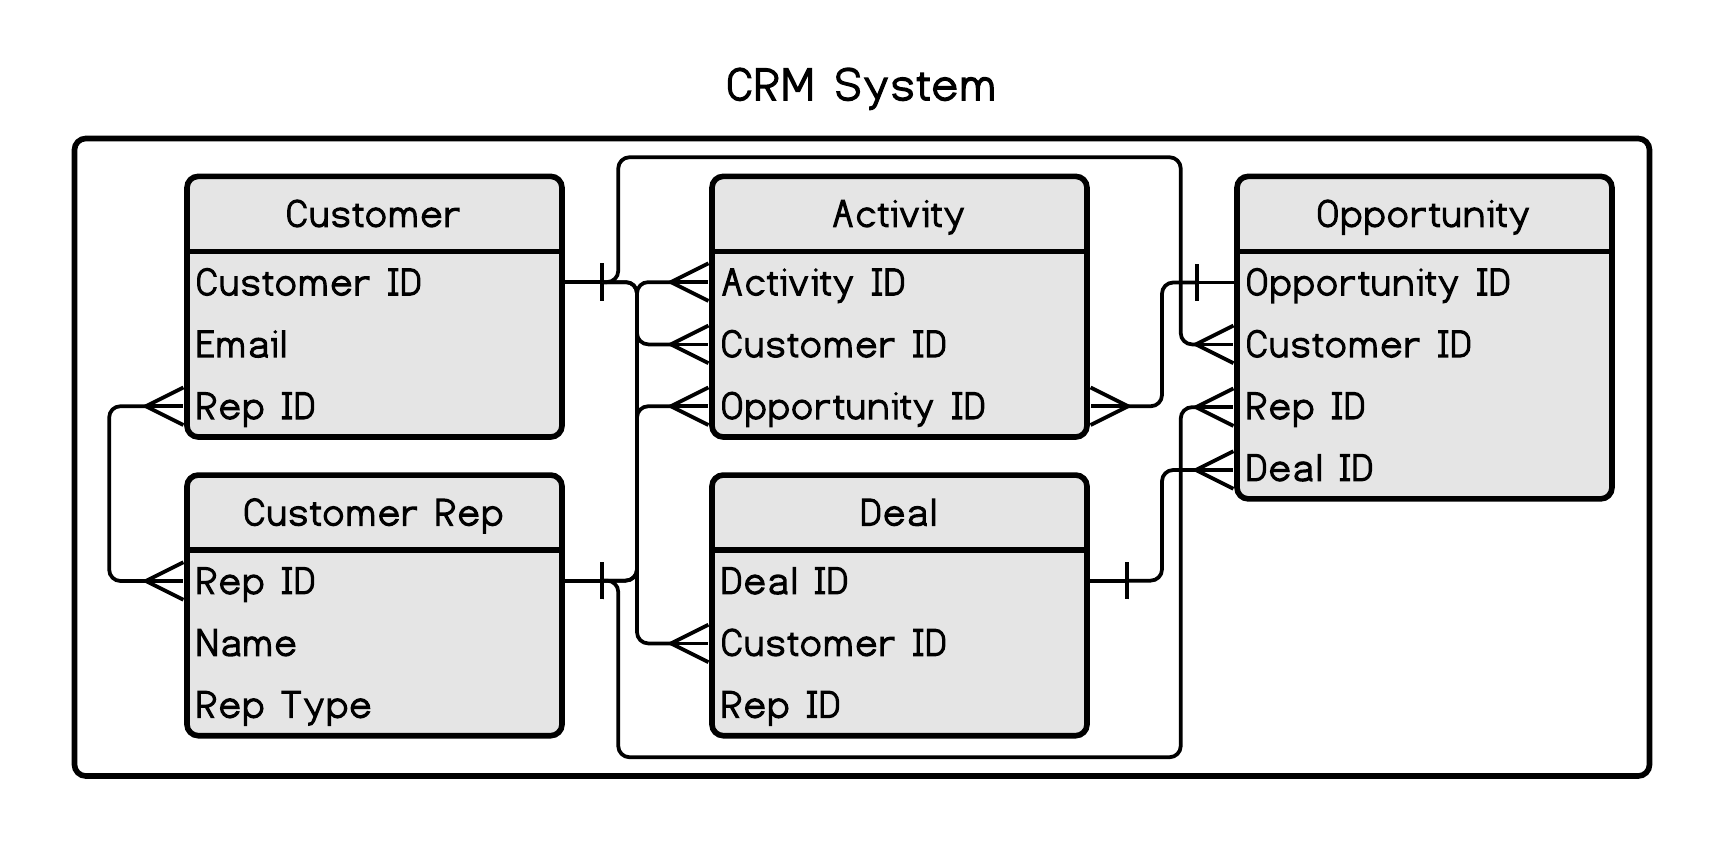
Figure 1.3: CRM system data structure
The data in figure 1.3 looks slightly different. This is because other CRM systems may have different ways of querying the data. For example, Salesforce uses SOQL, which looks similar to SQL, but it forces you to traverse relationships a little differently. So let’s take a look at this data.
------------------------------------------------------------------
-- SQL example example
------------------------------------------------------------------
SELECT  A.customer_id
       ,A.ticketing_system_id
       ,B.deal_id
       ,C.opportunity_id
FROM Customer A LEFT JOIN deal B ON A.customer_id = B.customer_id
                LEFT JOIN opportunity C ON B.deal_id = C.deal_id
WHERE A.email_addr = "Ted.Williams@someserver.com"
This data may need clarification because the relationships are more complex than in the previous example.
| customer_id | ticketing_system_id | deal_id | opportunity_id |
|---|---|---|---|
| l993w-233e-653r-88jg | 1940-2349-1243 | 1234 | q23w-234e-654r-678g |
| l993w-233e-653r-88jg | 1940-2349-1243 | 1234 | t567-3f45-6h78-234u |
| pp3w-232e-k54r-ww3b | 1959-9909-4567 | 3245 | y567-3f25-6h78-234p |
What do we have here? Mr. Williams has created (or has created) more than one account, and the accounts are not merged into one. This is a simple example of a problem you are likely to encounter and duplication problems are constantly faced. We have one Ted Williams, but the system regards him as two people. Business rules can mitigate some of these issues. For instance, the ticketing system could forbid users from using an email that is already in the system. While using email_address as a primary key has some advantages, there are always downstream issues that you must consider. Nothing is perfect. Someone may use a different email. Then you have one person, but it may be impossible to tell them apart. Your rules may make a problem worse.
Garbage-in, garbage-out. You must clean this data to move to the next level of our hierarchy. Before we look at B.I., I want to cover an essential simple query. It is the core of B.I. work. I have asked a similar question during interviews for years, and almost everyone fails to answer it correctly despite its simplicity. Once you gain some proficiency in SQL, run this code in an engine. This is written in SQL server syntax and answers the question:
Can you create a list of Companies in each Industry ordered by revenue?
It looks simple, but make sure you understand what is happening. Everyone fails this test because they fail to think through it and invariably try aGROUP BY before giving up with a confused look on their faces wishing they had access to Google.
------------------------------------------------------------------
-- BI SQL example
------------------------------------------------------------------

CREATE TABLE #company (
    company VARCHAR(20),
    industry VARCHAR(20)
)
CREATE TABLE #revenue (
    company VARCHAR(20),
    revenue NUMERIC(12,2)
)

INSERT INTO #company (company, industry) VALUES
('Coca-Cola','Beverages'),
('Home Depot','Retail'),
('Lockheed Martin','Aerospace'),
('Boeing','Aerospace'),
('BOA','Banking'),
('Wal-Mart','Retail'),
('Amazon','Retail'),
('Total Wine','Retail')

INSERT INTO #revenue (company, revenue) VALUES
('Coca-Cola','2000000'),
('Home Depot','1500000'),
('Lockheed Martin','3000000'),
('Boeing','5000000'),
('BOA','900000'),
('Wal-Mart','8500000'),
('Amazon','1425000'),
('Total Wine','75000')

SELECT
  RANK() OVER(PARTITION BY A.industry ORDER BY B.revenue DESC) [rank],
  A.industry,
  A.company,
  B.revenue
FROM #company A LEFT JOIN #revenue B ON A.company = B.company
ORDER BY industry, [rank]
You’ll constantly need to do this exercise. If you are working with large data sets leveraging SQL, this method will be preferable to leveraging other techniques since it is optimized for these sorts of data gymnastics.
1.2.2 Business Intelligence
Business Intelligence is a loaded phrase and can mean many different things. However, enabling a B.I. capability is possible once you’ve established some good data structure. This portion of the chapter will discuss B.I. at a high level and some differences in the data structure that enables more sophisticated reporting.
I usually place Business Intelligence under two categories:
- Reporting
- Research
A Customer Relationship Management (CRM) component also typically falls under this Business Intelligence umbrella in practice at clubs. There are many reasons for this; the biggest is simply legacy. Another reason is that the CRM system typically houses much of the data that may be used for reporting. It’s a natural match in a relatively small company, where people must wear multiple hats. Reporting systems such as Tableau, Qlik, Looker, Business Objects, etc., depend on having well-structured data. Be cautious about tools as well. You can easily abuse them and not get the results you are looking for. Philosophy of use is essential. Once you have your data in a good spot, you can tell people about it. Gathering insight from your data can take many forms, but it is often placed in one of four categories in figure 1.4.
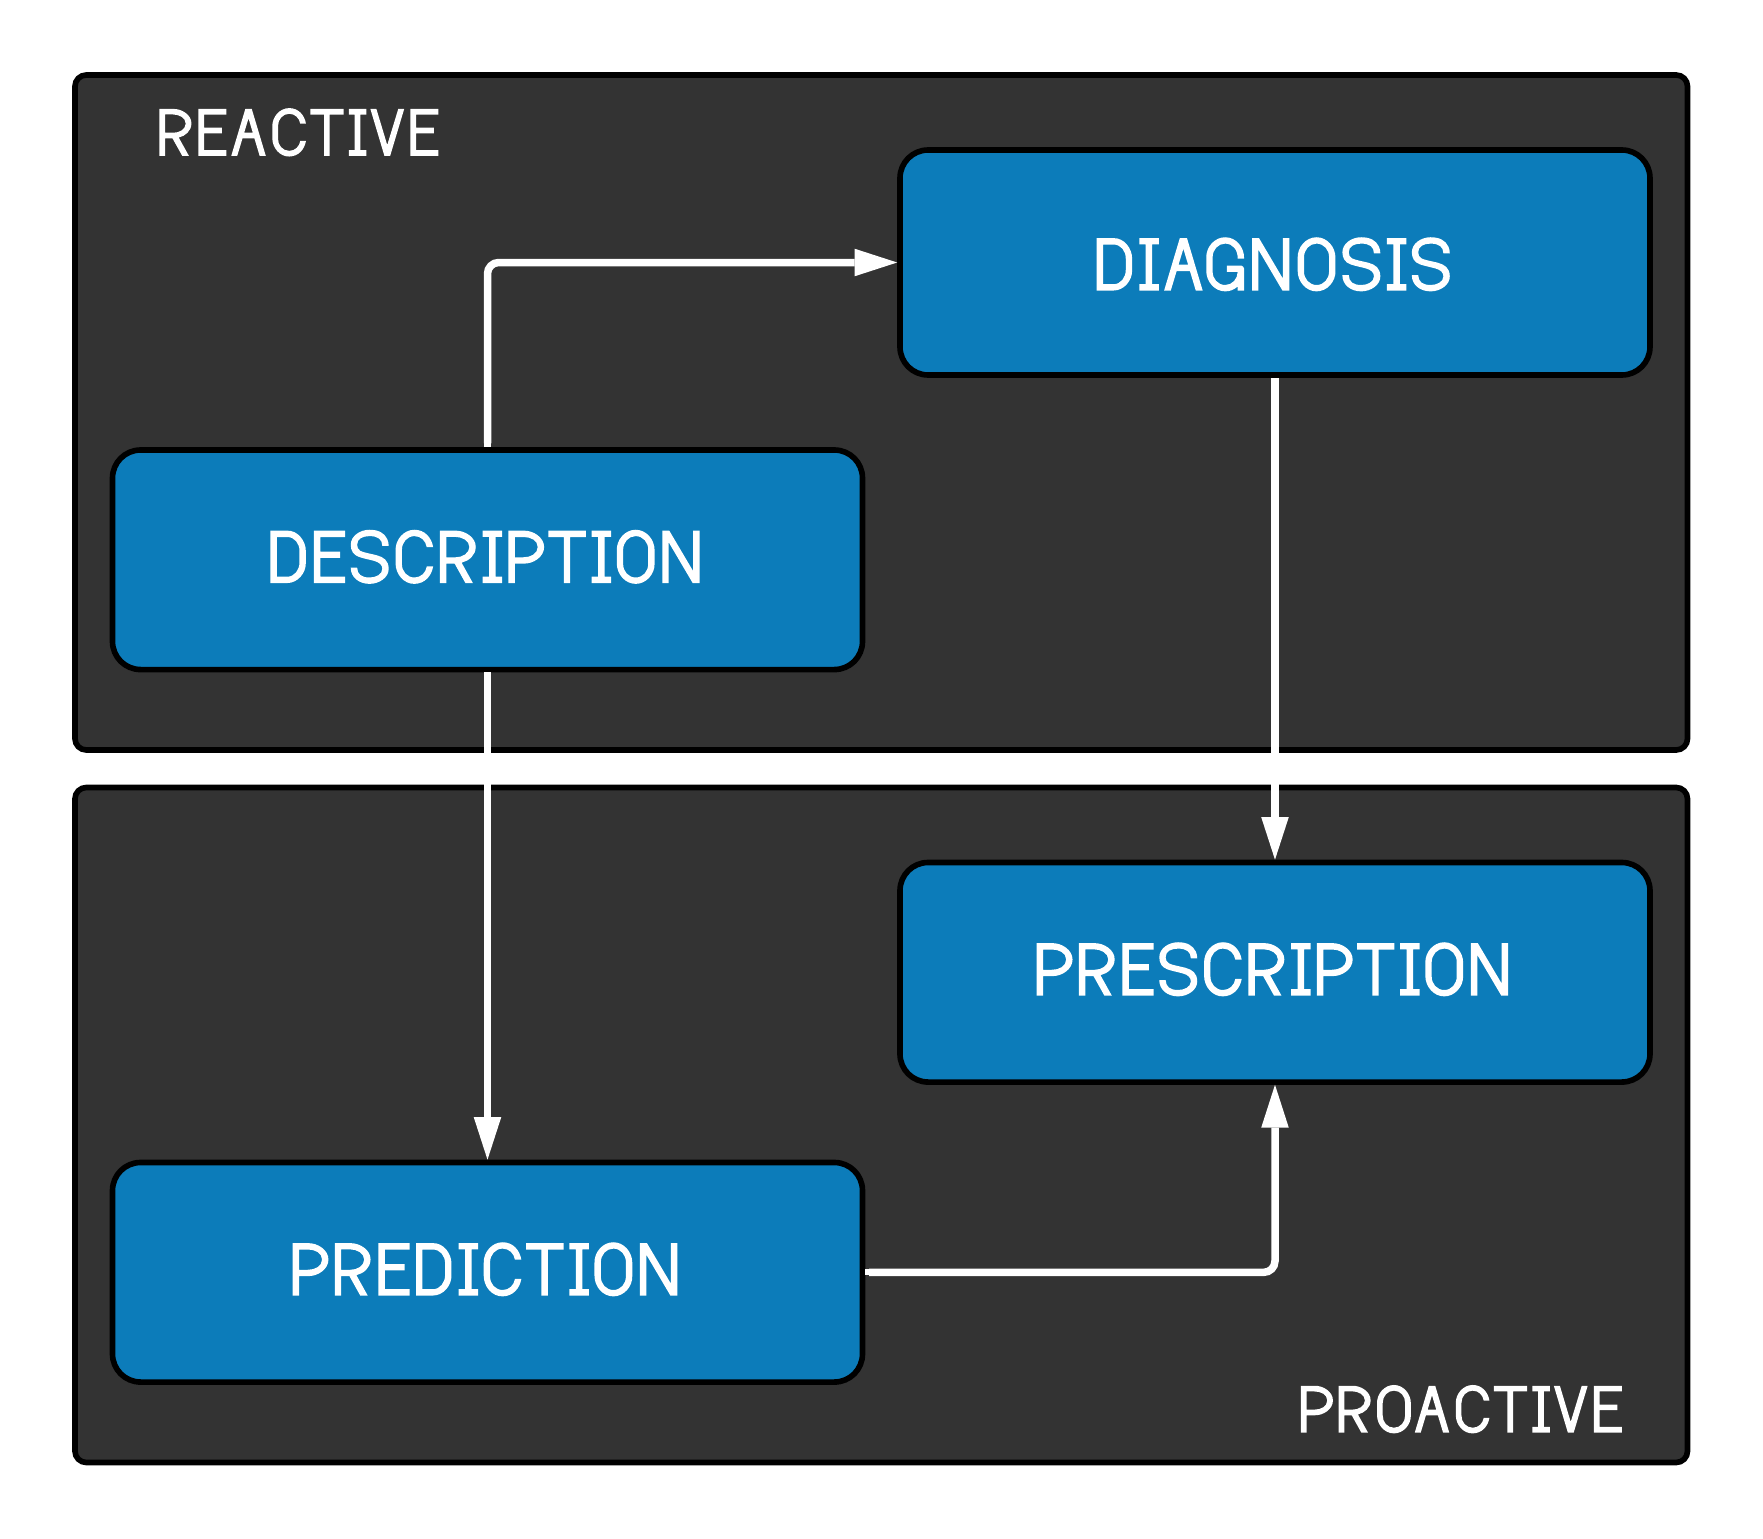
Figure 1.4: Four categories of reporting
The first stop is reactive reporting Description and Diagnosis. Once you have your data structured appropriately, you can produce backward-looking reports. These reports are typically the bread and butter of a Business Intelligence department. For example, you are answering questions about how much a rep sold or how many tickets were sold during a specific time frame.
Prediction and Perscription are forward looking. You might integrate predictive models into your reporting that indicate whether sales goals will likely be met. We’ll talk about how that might be accomplished in the next section. Prescriptive reports might tell you what you should do about a problem once it has been diagnosed. In our context, a prescriptive report might enable a manager to reroute marketing dollars to more efficient channels. For instance, the report could identify diminishing returns on marketing spend through a particular social channel and suggest one with demonstrably greater efficiency.
1.2.2.1 Business Intelligence data structure
Data structure for a B.I. system doesn’t necessarily have to be different than what you may find in a typical relational database. You can plug a system such as Tableau 14 into your database and likely get some good capability. However, the data is most efficiently restructured into facts and dimensions. Data structures can also take more complex forms, such as data cubes 15, JSON-like hierarchical data, or other more exotic forms that can handle array-like data within specific database fields. We’ll focus on the simple fact and dimensions.
You can think of a fact as something that will be aggregated. It is a number. Dimensions are the features that you use to understand your numbers. Consider the diagram in figure 1.5.
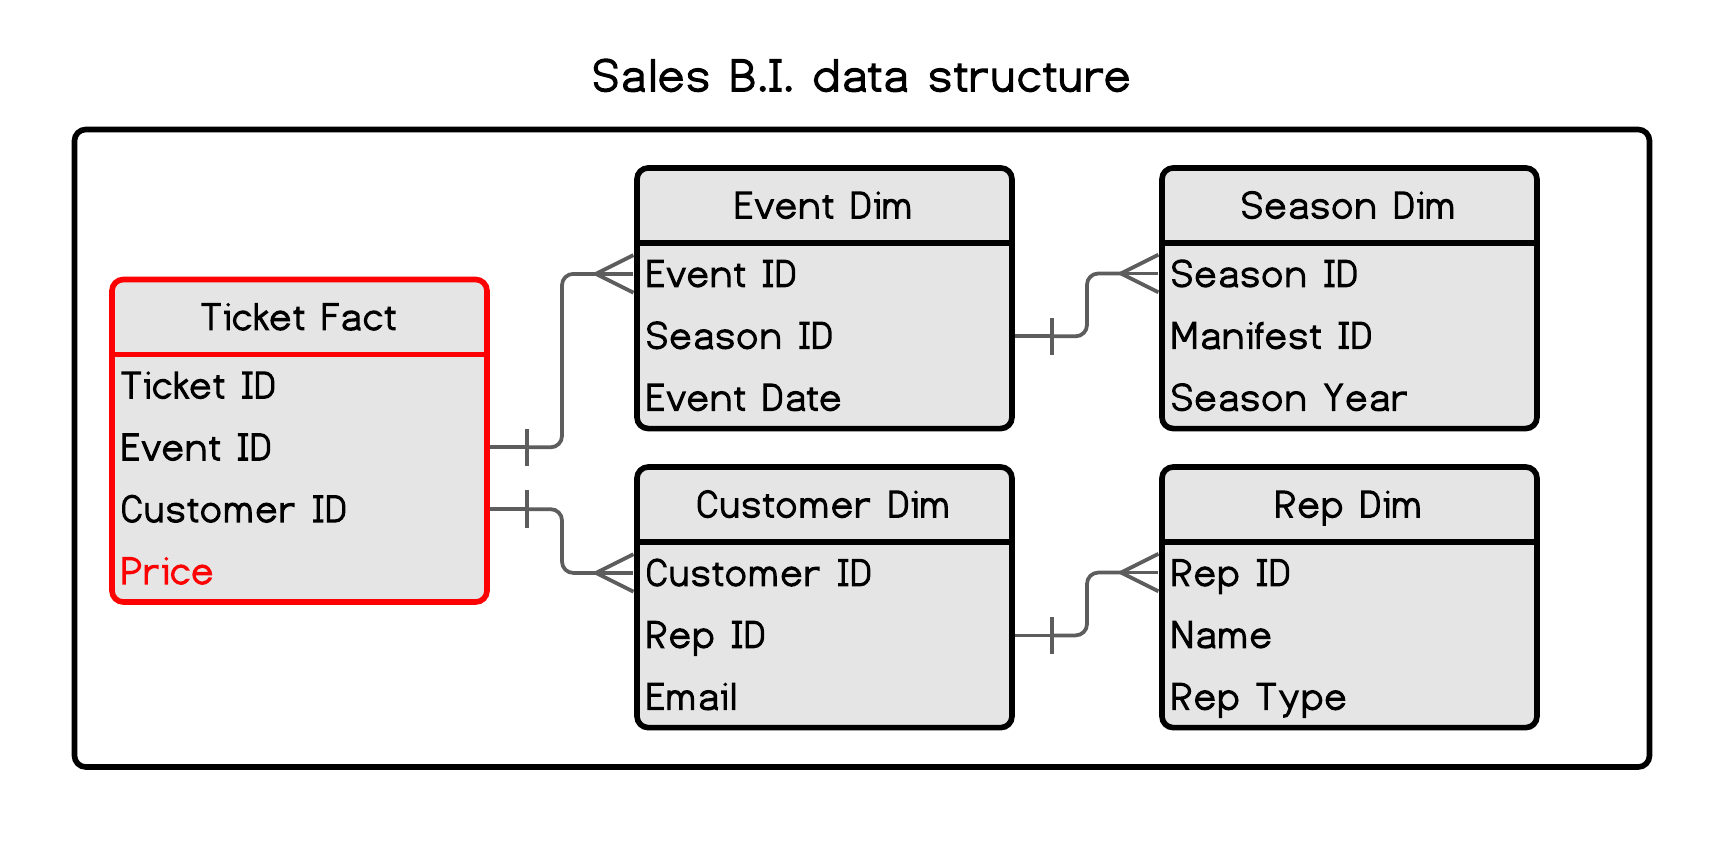
Figure 1.5: Business Intelligence data structure
These tables look similar to what you saw in figure 1.3. The main difference is conceptual. In the earlier diagram, no tables were necessarily prioritized over others. Look at the tables and consider the customer the central table with features radiating from that specific customer. The customer has a rep, purchases tickets, may have a plan, etc. In this diagram, the Ticket is central. Since B.I. tools are at heart aggregation machines, this structure is fundamental. If you want to perform some math on a feature such as ticket price, you put it in the fact table. This allows you to perfromantly answer all kinds of questions such as:
- How much did customer A spend on tickets in 2018?
- How much was spent on tickets in 2021?
- How many customers does rep A have, and how much did they spend in 2019?
As a rule, I prefer to structure the data how I would want it within the database. While this isn’t always feasible or efficient, it does have some advantages. It can be efficient because flattening the relationships into fewer tables can make your software run more quickly. You have removed the need to traverse a relationship. It also means that you are less dependent on learning all the capabilities of the B.I. platform. It makes things more straightforward from that perspective. This works well when the person doing the B.I. work is also the data engineer. The problem is that it needs to be more scaleable and can get confusing. It could lead you to build custom systems where you aren’t constrained in the same ways.
There are also some pitfalls that you should be aware of. You can work around these issues. However, you can also encounter problems with Cartesian joins 16. This means that you can double-count a value if you aren’t careful. This is common if you have constructed a snowflake schema for your facts and dimensions tables.
1.2.3 Analytics
The term analytics is at least as broad as business intelligence. In our context, I distinguish it from business intelligence because it is less concerned with displaying information and more concerned with interpretation. Additionally, getting your base B.I. functionality running is more straightforward than applying analytic techniques to your data. Ultimately, business intelligence and analytics will work together and form the backbone of your (antiquated but valid term) decision support systems.
Analytics refers to applying an operation to your data and gaining additional insight from that modification. Getting data structured appropriately is critical. I typically put analytics tools into one of two categories despite there being many more, including simple spreadsheets:
- Regression
- Machine learning
Let’s take a minute to explain these terms because there is some overlap. You may or may need to become more familiar with regression. Regression can get very technical, and regression analysis is dogmatic and rigorous. We’ll use it heavily, and you will need to understand how it works. I recommend getting a reference book on the subject. There are many. My favorite is “An R Companion to Applied Regression.” (John Fox 2019) Let’s try a quick explanation of ordinary least squares regression to demonstrate its power. We will build this explanation in R but wait to show you much code until the next chapter.
I am going to explain regression here in the simplest way possible. I am not a mathematician, and you don’t have to be one to leverage regression. Also, we aren’t working with clinical trials of a drug. We are working with fuzzy business problems. So exacting rigor isn’t as necessary. The following section will take you through a simple explanation of the most basic form of regression and explain how I think about it.
1.2.3.1 Regression
Examine the following meme I created with an online meme generator:
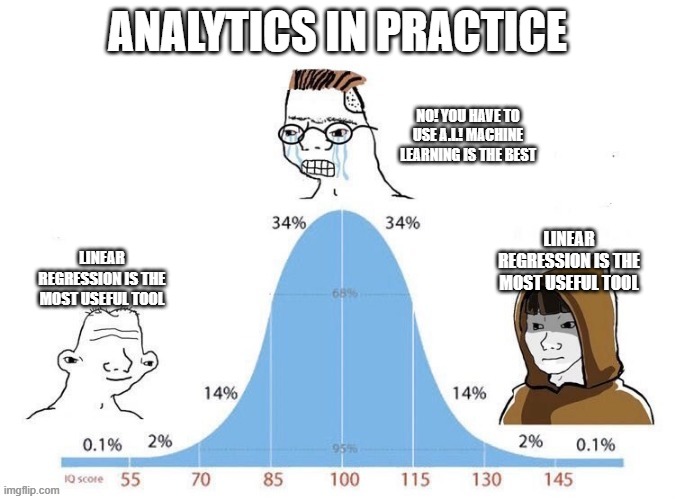
Figure 1.6: Your future thoughts on regression
This is an incredibly reductive meme. You can’t use linear regression for generative art or computer vision. However, you will use it a lot, and it has many advantages. So make sure you understand it. Eventually, you will agree with the meme when working on most of the problems you will face. The following section explains how I like to think about it.
The familiar linear equation takes the form:
\[\begin{equation} \ {y} = {m}{x} + {b} \end{equation}\]
In this equation, the Y is explained by x, where m is equal to the slope of the line and b is equal to the y-intercept. If we apply a list of x values (-5,-4,-3,-2,-1,0,1,2,3,4,5) to a linear equation with slope two and y-intercept of five, we will get the graph in figure 1.7.
\[\begin{equation} \ {y} = {2}{x} + {5} \end{equation}\]

Figure 1.7: Output of our linear equation
Your data points may not fit a perfect linear equation. Regression is looking for the line through these points that minimizes the sum of squared errors (see figure 1.8. The sum of squared errors represents ( SSE ) the distance between each point and the line. Look up the word orthogonal to see how this can vary. You square the errors so that negative numbers don’t impact the results.

Figure 1.8: Output of our linear equation
In multiple linear regression, we are simply switching the linear equation around and adding terms:
\[\begin{equation} \ {y} = {b} + {m_1}{x_1} + {m_2}{x_2} \end{equation}\]
The basic form is denoted similarly to the following equation:
\[\begin{equation} \ \hat{y} = \alpha + \beta_1 x_1 + \beta_2 x_2 + \epsilon \end{equation}\]
A definition might read, “The idea is to express the class as a linear combination of the attributes with predetermined weights.” (Ian H. Witten 2011) I just think about it as finding the best average line through your data where x explains y. The standard error represents a normal distribution that is split by the line. Once again, I don’t want to push statistics reading too much here. Still, I recommend picking up any book on statistics or Googling multiple-linear regression if you aren’t reasonably familiar with it. You’ll use it a lot as an analyst.
Additionally, familiarize yourself with the different forms of regression; Orthogonal, Poissan, Ridge, etc. There are lots of problems that can be solved if you apply the correct technique.
That is as deep as I want to go here. We will use this tool often in subsequent chapters and go into more detail. I want to take the same simple approach to explain Machine Learning.
1.2.3.2 Machine Learning
Machine learning is different as a concept, but under the hood, it is just statistics. This has been explained in many ways. At its heart, we are looking for patterns in data to make predictions. Also, don’t worry about A.I. taking your job. Worry about the person that knows how to use it taking your job.
There are three main types of machine learning:
- Unsupervised Learning
- Supervised Learning
- Reinforcement Learning
Each of these variations is useful for solving different types of problems. We’ll also cover them in more detail in subsequent chapters. Additionally, several techniques fall under the machine learning umbrella, including:
- Decision Trees
- Random forests
- Gradient boosting
- Support vector machines
- Neural networks
You can also use ensemble techniques. I typically explain machine learning through a basic explanation of a completed decision tree. An in-depth explanation of decision trees gets mathy. This basic explanation comes from the book “Data Mining” (Ian H. Witten 2011). This book utilizes a program called WEKA, but most or all of the concepts have implementations in R or Python.
We are going to begin looking at some of our data. If you are digging into code, now is the time to install R and R studio. We will talk more about that in the next chapter. You can install the FOSBASS library that accompanies this book using the following command:
#-----------------------------------------------------------------
# Install FOSBAAS Library
#-----------------------------------------------------------------
library(devtools)
devtools::install_github("Justin-Watkins/FOSBAAS"
                         ,ref="master"
                         ,auth_token = NULL
)
Type the package’s name into your editor, and the multiple functions and data sets should appear after you type two semicolons. Type a question mark before data sets or functions to see the documentation.
#-----------------------------------------------------------------
# View data set documentation
#-----------------------------------------------------------------
?FOSBAAS::customer_renewals
A decision tree is simply an organized set of cascading questions and answers that are simple to understand at a high level. Let’s consider a simple data set:
#-----------------------------------------------------------------
# Customer renewal data
#-----------------------------------------------------------------
renewal_data <- FOSBAAS::customer_renewals| variable | class | first_values |
|---|---|---|
| accountID | character | WD6TDY7C151R, X3SB8ADEML22 |
| corporate | character | i, c |
| season | double | 2021, 2021 |
| planType | character | p, f |
| ticketUsage | double | 0.728026975947432, 0.992104738159105 |
| tenure | double | 2, 19 |
| spend | double | 4908, 16410 |
| tickets | double | 6, 2 |
| distance | double | 61.6614648674555, 19.5341155295423 |
| renewed | character | nr, nr |
We’ll see this data several times throughout the book. It contains several variables and a column that states whether the fan renewed season tickets. First, let’s apply a decision tree to the data. We’ll only look at one factor, distance. For this example, we used two libraries: rpart (Therneau and Atkinson 2022) and rpart.plot (Milborrow 2022).
#-----------------------------------------------------------------
# Customer renewal data
#-----------------------------------------------------------------
d_tree <-
rpart::rpart(formula = renewed ~ distance,
             method  = "class",
             data    = renewal_data)
rpart.plot::rpart.plot(d_tree,
                       type  = 4,
                       extra = 101)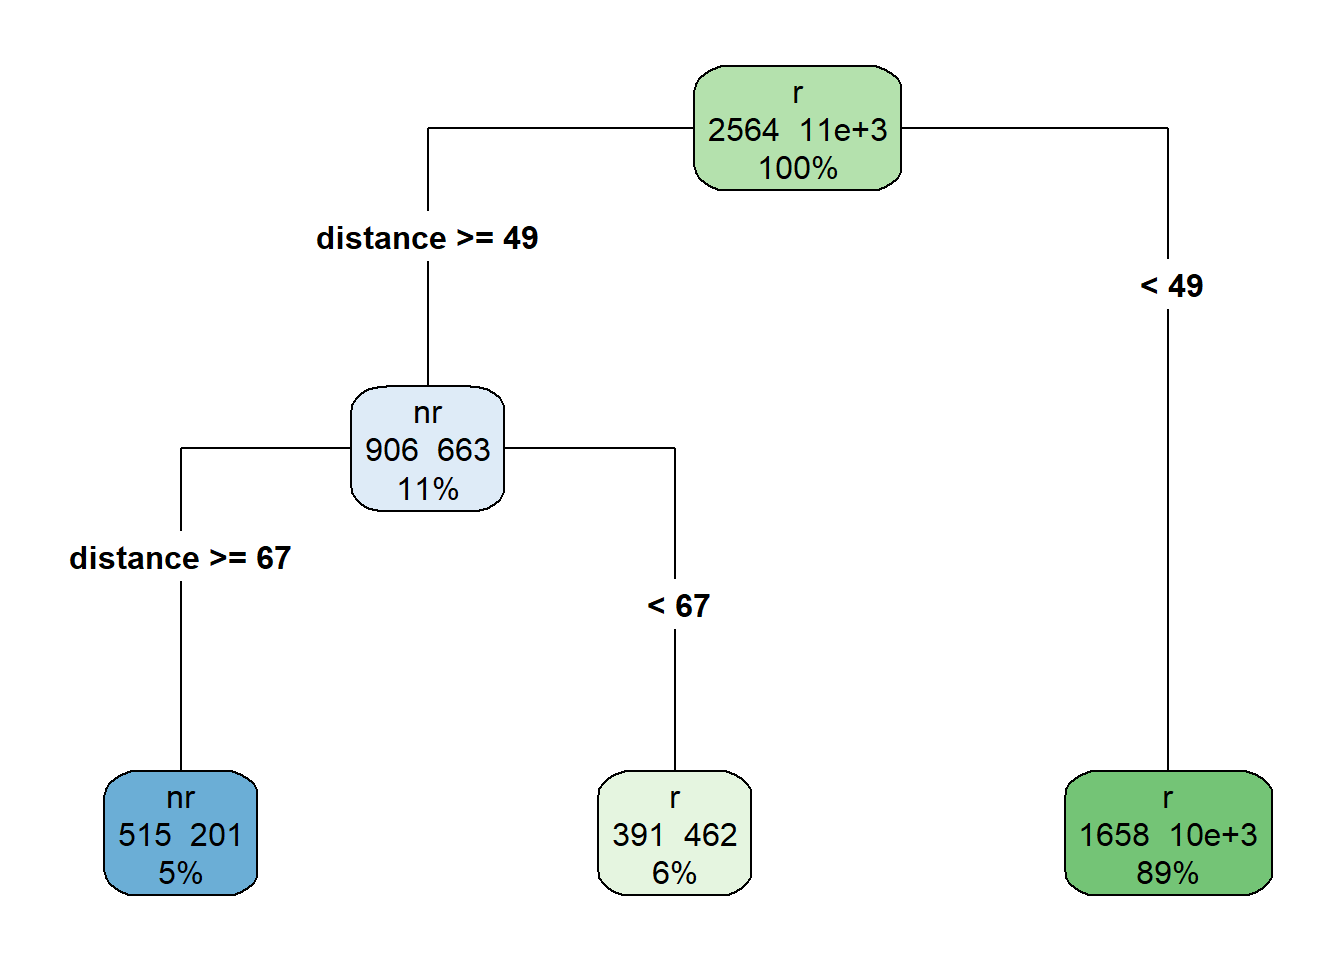
Figure 1.9: Decision tree example
This tree (figure 1.9) is simple to read. In the top node, 2,564 people did not renew (nr), and over 11,300 did. The first split separates people that live more than 49 miles from the venue. Of those people, 906 did not renew, and 663 did renew. The third split separates people who live more than 67 miles from the park. Again, of those that live more than 67 miles from the park, 515 did not renew.
A decision tree performs splits in one of multiple ways, and many resources can illustrate the methods. At this stage, the main thing to understand is that the nodes are more similar to each other than to other nodes. Each node is more homogeneous than sister nodes.
This is machine learning at its simplest. A set of cascading questions split in formulaic ways classifies a response variable. While methods differ, at their heart, many machine learning processes are functionally very similar despite using wildly diverging methods.
1.2.4 Automation and Integration
After you have developed some basic B.I. and analytics capabilities, you’ll quickly want to find ways to put them to work. Ad hoc analytics has its place, but to truly reap the rewards of your work, you will need to build an engine that allows you to automate some of the storytelling. This is where analytics intersects I.T. work. Operationalizing your analytics procedures requires a little different knowledge set. There are also other approaches.
AWS and Google have taken considerable strides in building frameworks that natively integrate analytics into your DBMS. Gone are the days of writing SQL wrappers for some R or python script sitting on some server in the basement. Let’s take the same simple approach to explain what I mean here.
These two functions (Automation and Integration) are self-explanatory. Automation refers to removing human interaction. Integration refers to operationalizing your outputs by extending your data into commerce engines.
Automating procedures provides several benefits:
- It is a labor multiplier
- It enables more strategic thought to go into staffing decisions
- It keeps reports up-to-date
Automation relies on several interlocked technologies, is more related to data engineering, and primarily belongs to an information technology group.
Integration refers to two elements:
- Integrating solutions across your organization
- Integrating with third parties to extend capabilities
Interestingly, integrating with third parties is the easy part relative to integrating solutions internally. Integrating solutions internally is much more difficult. This typically requires change management and a sponsor in the upper levels of management. For example, perhaps your organization introduces a productivity suite such as Slack17 or Teams18. Will simply introducing and deploying this technology cure an addiction to email? The answer is “no.” How might you increase adoption?
Figure 1.10 demonstrates a simplified version of the entire process from data sources to the feedback loop you are creating with your marketing channel partners. Of course, when we refer to marketing channel partners, we could be referring to Google’s add network, Facebook, or many others.
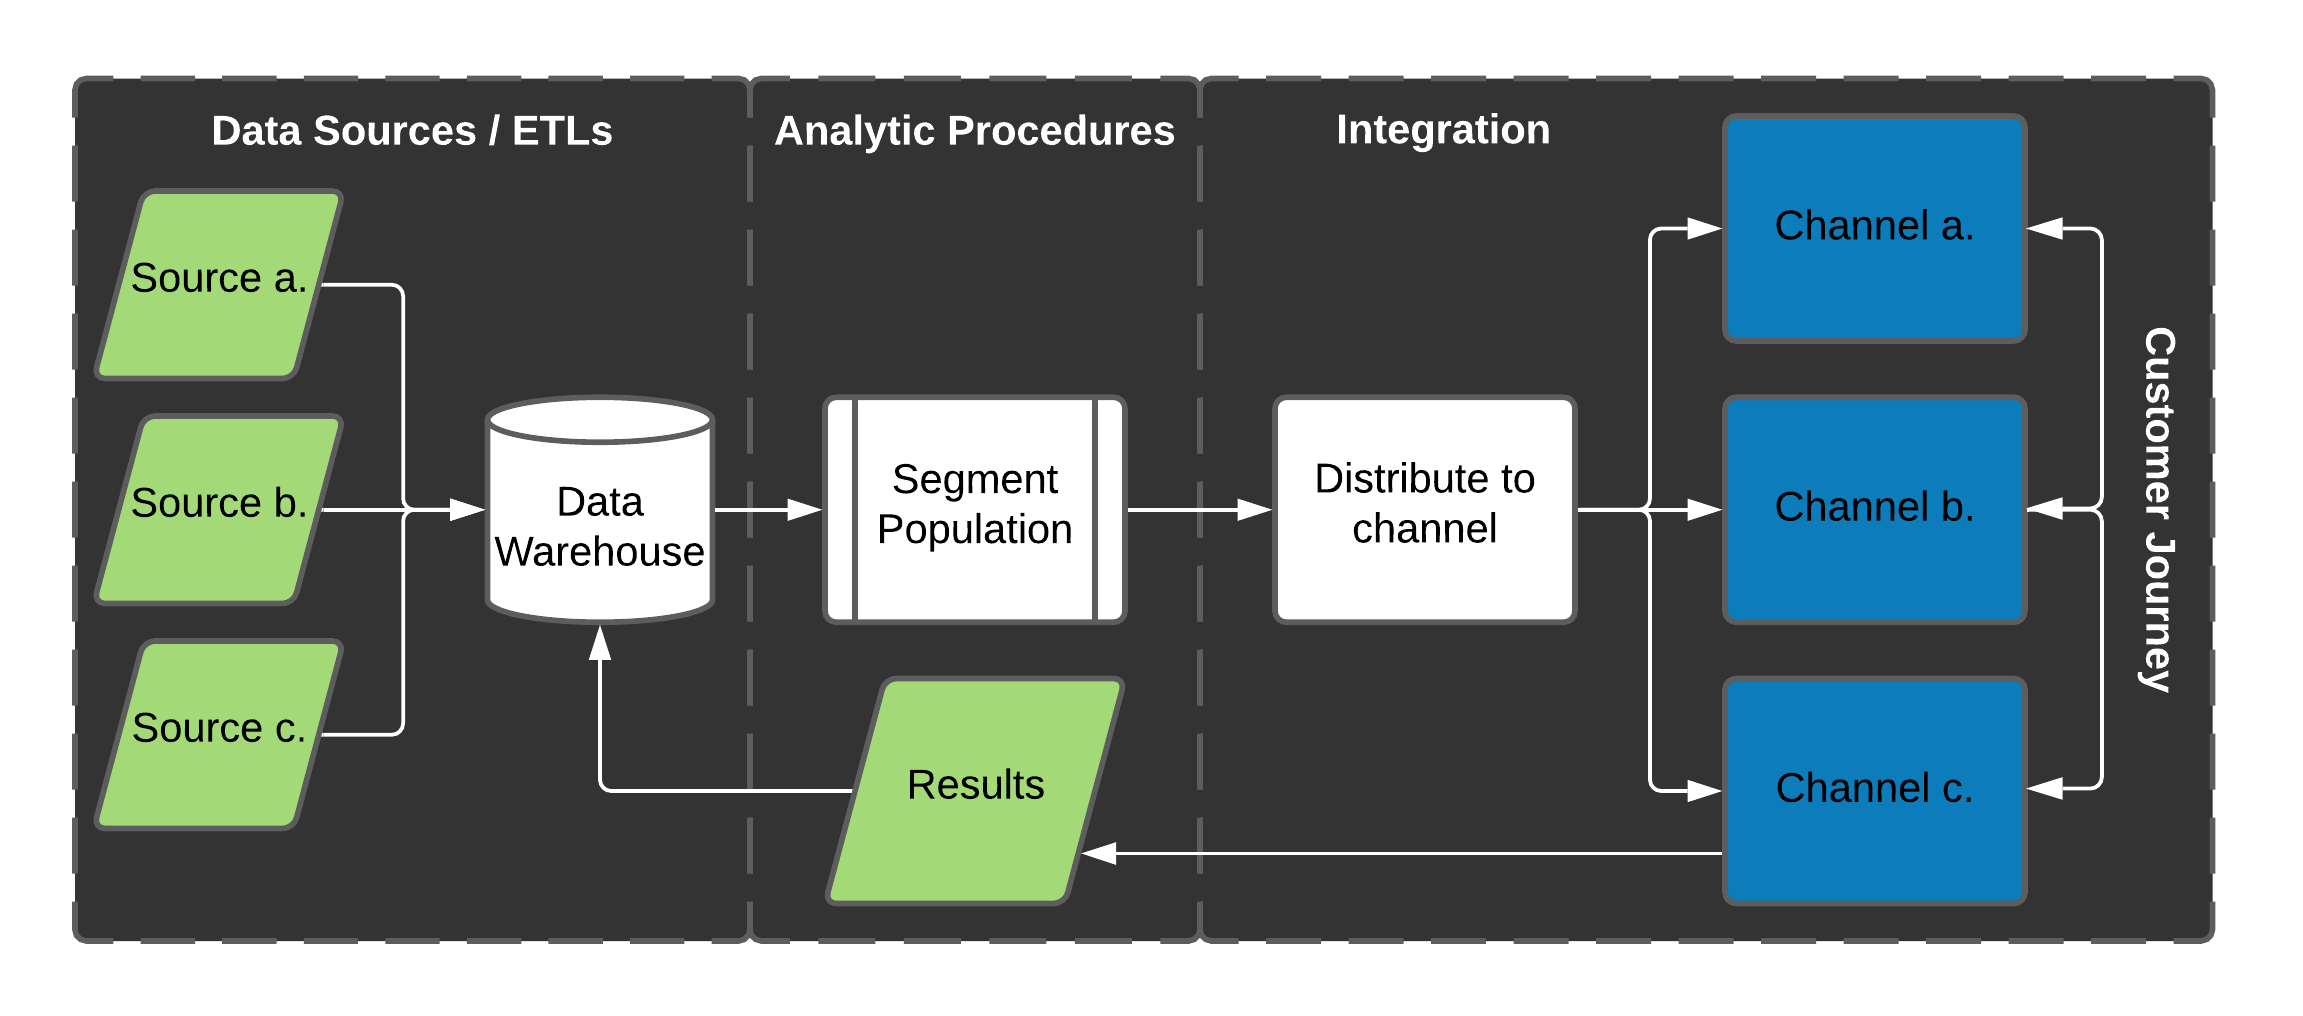
Figure 1.10: Operationalizing analytical procedures
While these features used to be reasonably distinct, new technologies are making it much easier to link these activities into one system. As someone leading these efforts, your job will be to think of how you apply these measures instead of how to accomplish them. Additionally, we are focused on the tech here. Several operational considerations impact automation and integration, such as content creation, collateral, timing, verbiage, and budgets. For instance, before you distribute to a channel, you’ll need to create artwork, have a clear message and call to action, a website may need to be updated, and other communication may have to be considered. Nothing is ever easy.
1.3 Key Performance Indicators
This section will explain an application of a KPI. This piece of feedback is critical for understanding how well you are performing (typically against some arbitrary or historic benchmark). I’ll also refer back to an earlier paragraph about the stock market. Analytics is contextual. What is a KPI? A KPI is a figure that links business performance to some desired outcome. For example, in Baseball, the number of walks a player takes is a KPI that will likely predict on-base-percentage. Analytics groups can establish a causal link between On-base-percentage and wins19. If you are in the market for a player, you might weigh walks more heavily than other metrics. On-base-percentage might be a KPI, and walks might be the key to increasing on-base-percentage leading to more wins. The following paragraphs will discuss and criticize the most commonly used KPI at clubs: Percap, or average price paid per ticket.
It is easy to make incorrect judgments when armed with the blunt instrument of data. Per-Cap (or average ticket price) is likely the worst. Per-Cap is a commonly used KPI that is used for comparing the effectiveness of sales and pricing strategy:
\[\begin{equation} TotalTicketRevenue / NumberOfSeatsSold \end{equation}\]
On the surface, this metric seems interesting. However, there are several issues with it:
- The denominator changes for every game that is not sold out. In this case, you are comparing fractions with different denominators. The mix of tickets could vary wildly from game to game. This alters interpretation and leads to issue number two.
- The number becomes diluted and decreases when more tickets are sold. As more tickets are sold, a higher proportion of less-expensive tickets are sold, which tends to drive down the per-cap. Is a high per-cap good? The answer is that it depends. Let’s illustrate what I mean:
\[\begin{equation} \$1,400,000 Ticket Revenue / 34,000 Tickets sold = \$41.80 \end{equation}\] \[\begin{equation} \$1,600,000 Ticket Revenue / 40,000 Tickets sold = \$40.00 \end{equation}\]
How do you reconcile the $1.80 difference in per-cap? Does the higher number indicate that you priced more efficiently under the lower revenue scenario? The answer depends on many factors. Considered in isolation, this number has little meaning. A better metric is Yield. Yield is just as simple:
\[\begin{equation} TotalTicketRevenue / AvailableTickets \end{equation}\]
Yield is more intuitive and increases with every sale since it isn’t penalized by unsold inventory. So what does the previous example look like from a yield perspective?
\[\begin{equation} \$1,400,000 Ticket Revenue / 40,000 Available Tickets = \$35.00 \end{equation}\] \[\begin{equation} \$1,600,000 Ticket Revenue / 40,000 Available Tickets = \$40.00 \end{equation}\]
Yield is higher when revenue is higher now that we hold the denominator constant. Hopefully, this indicates that we were more efficient at selling our seats or demand at higher prices buoyed up revenue. This number is much easier to interpret and to leverage for hypothesis testing. The easiest way to consider this metric is to visualize it. A simple scatter plot (figure 1.11) does the trick. In an actual scenario, the average ticket price isn’t tightly correlated to overall revenue until games approach a sellout and percap approximates Yield.
#-----------------------------------------------------------------
# percap scatter plot
#-----------------------------------------------------------------
set.seed(714)
percap_data <- tibble::tibble(
  percap = rnorm(81,40,10),
  revenue = rnorm(81,1000000,200000)
)
x_label  <- ('\n Percap')
y_label  <- ('Revenue \n')
title    <- ('Revenue vs. Percap')
scatter_percap <-
  ggplot2::ggplot(data  = percap_data,
                  aes(x = percap,
                      y = revenue))                   +
  geom_point(alpha = .9, color = 'dodgerblue')        +
  geom_rug(color = 'coral')                           +
  scale_y_continuous(label = scales::dollar)          +
  scale_x_continuous(label = scales::dollar)          +
  xlab(x_label)                                       +
  ylab(y_label)                                       +
  ggtitle(title)                                      +
  graphics_theme_1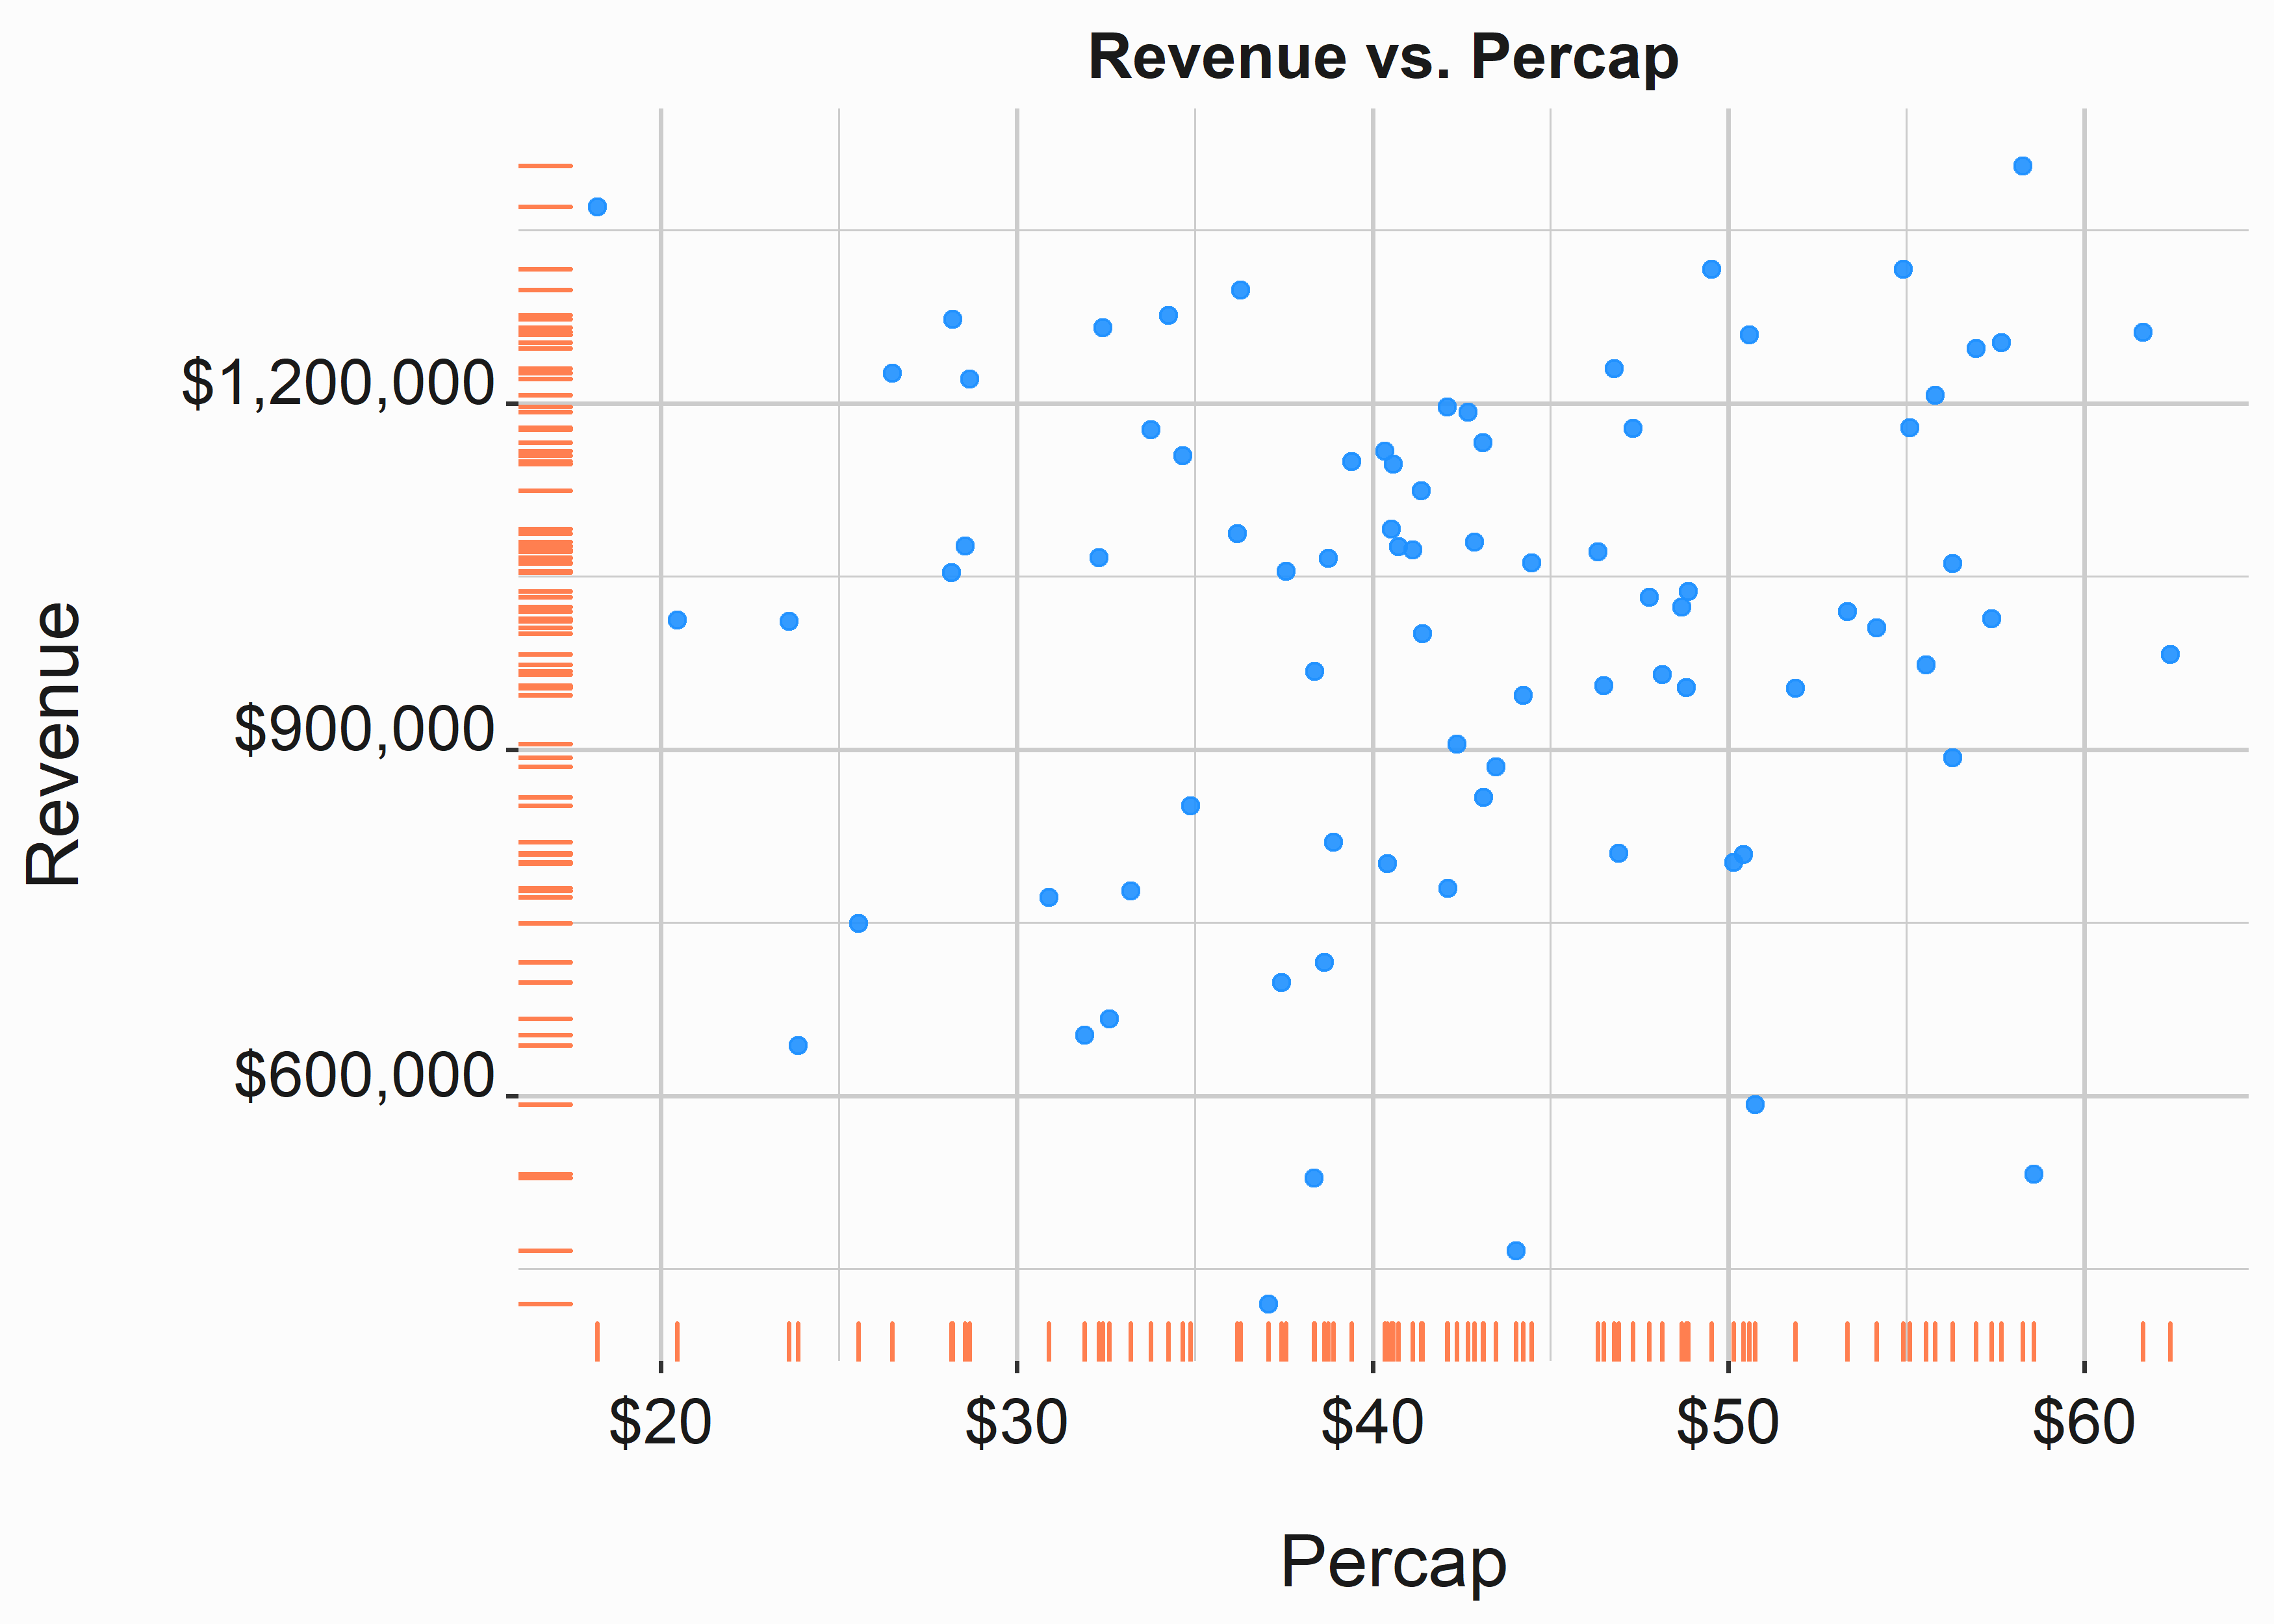
Figure 1.11: Scatterplot of revenue and percap
Another metric that could be used better is Sales on or by date. This metric asks how many sales I had on a particular date in the previous year. This metric may be the biggest liar out of any commonly used KPI. It can be fraught with distortion in Baseball because of the schedule. It likely has more validity when a sport has fewer games or has a higher FSE base. FSE stands for Full Season Equivalent and represents the number of tickets sold to individuals on a season (or modified season) basis.
Sales by date is problematic for a few different reasons:
- If you compare yourself to a different team, it doesn’t consider the admixture of tickets. A team with 20,000 FSEs will look dramatically different than a team with 6,000 FSEs.
- Once your schedule has begun, the admixture of games will significantly influence the outcomes. What does this mean?
We’ll see in chapter 6 which elements will most influence ticket sales. Sales-by-date doesn’t consider game dates, opponents, on-field success, seasonality, game times, etc. Additionally, people purchase tickets at different times and for various reasons. Because of these differences, sales of a specific ticket class may look great after the first twenty games but could be better after the first forty games. Look at the line graph in chapter 3 3.6. If you built a cumulative line for each line, the results would look very different. Refrain from benchmarking off of sales-by-date. Instead, leverage forecasts that consider the underlying elements of the schedule. Consider a simple example (figure: 1.12). This illustration was created with publicly available data, and we’ll demonstrate how to make it a little later.
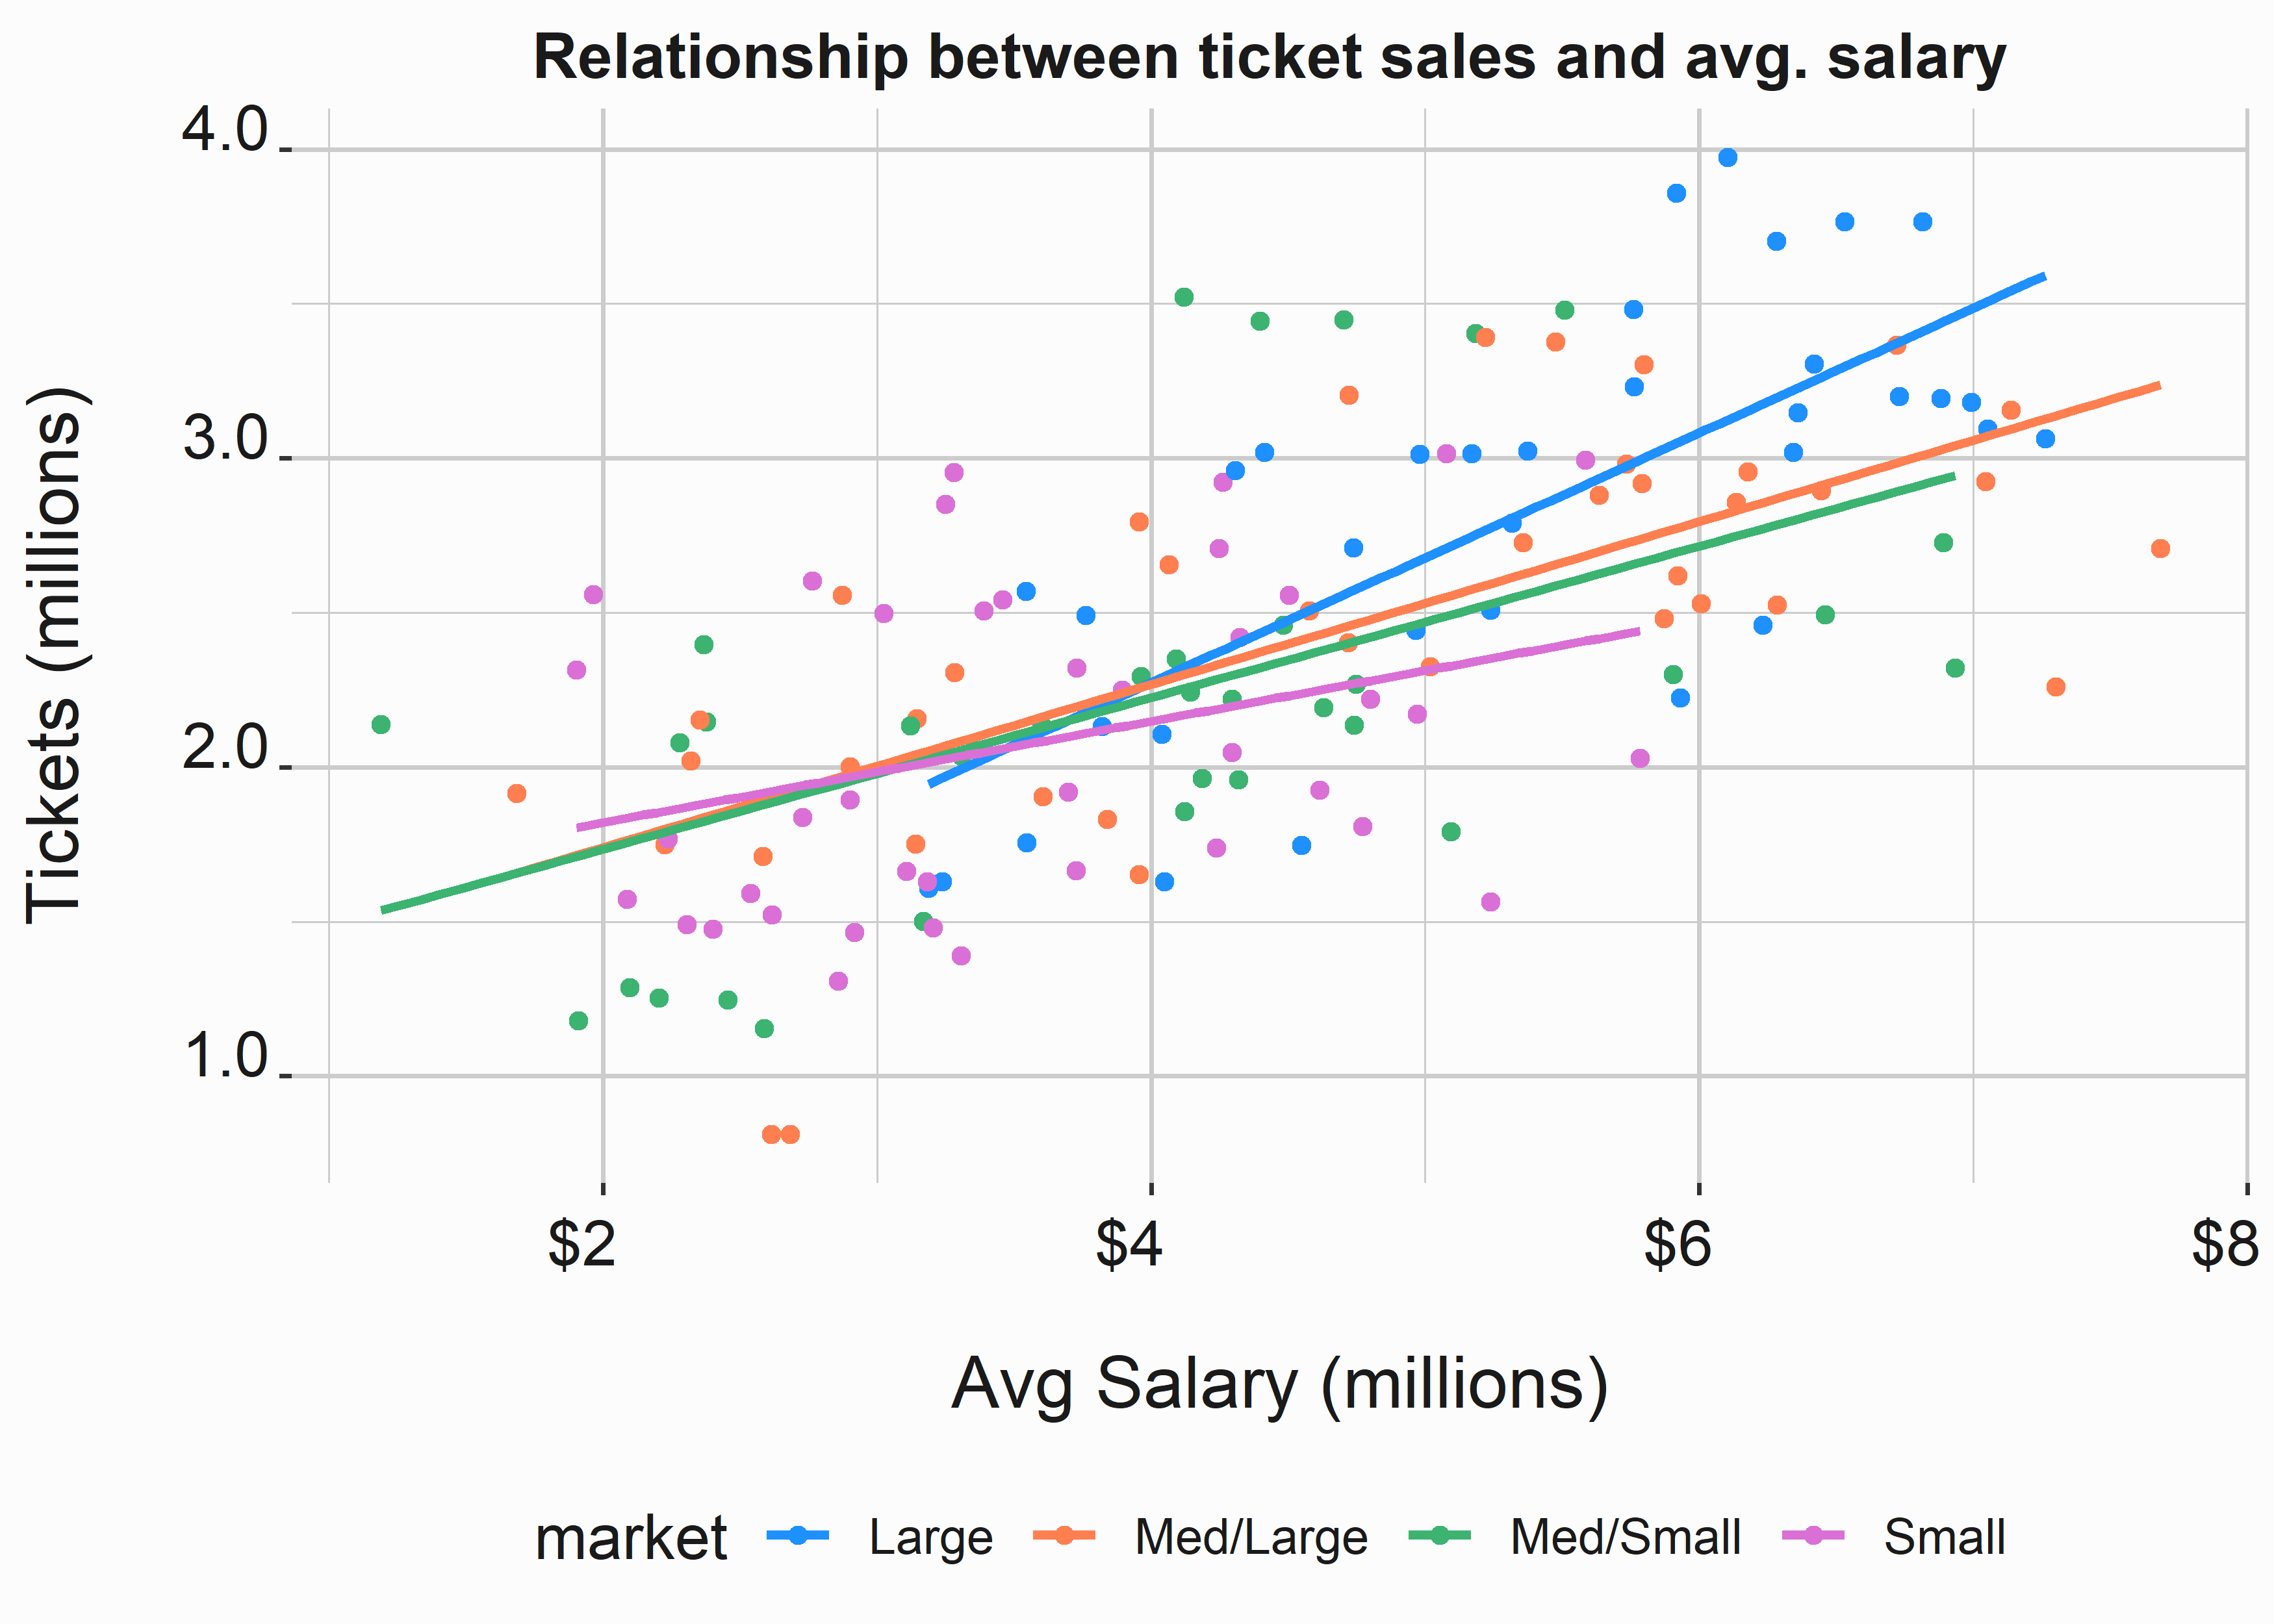
Figure 1.12: Relationship to avg salary and ticket sales
There certainly appears to be some relationship between the average salary of a player and the total number of tickets sold. The relationship might even be more substantial for teams in larger markets. Why is this the case? This top-down approach to forecasting demonstrates that the amount that players are paid (or if a few players are paid a lot of money) that ticket sales tend to be higher. We don’t see tight clusters based on market size. Higher pay may demonstrate better performance. Better performance might translate into more wins. More wins attract more earned media and fans, and your ticket sales increase.
This is an obtuse example, but it demonstrates the point. There are underlying mechanisms that likely do a reasonable job of explaining ticket sales. We didn’t even cover bottom-up forecasting elements such as marketing efforts!
The point of this section should now be clear. Many factors dictate performance. Some are within your control, and some are not. Running a team is similar to running a hedge fund. Sometimes it’s up, and sometimes it’s down. However, you need to understand why it’s up or down so that you can make smarter decisions. Bad KPIs don’t help you make smarter decisions. Leveraging appropriate KPIs has many salutary impacts, and good analytics always looks for the underlying mechanism at work.
1.4 Why do people buy tickets to sporting events?
Sports fandom is irrational. This irrationality can make sports challenging and infuriating to work with from an analytics standpoint. How can we determine if our marketing efforts are making a difference? Are we simply slaves to the whims and fancy of the mob? The answer is complex, and we will explore it a little in our chapter on forecasting and pricing, chapter 6. Additionally, the answer may (to a degree) exist in our genes.
“We have the ability (Under special conditions) to transcend self-interest and lose ourselves (temporarily and ecstatically) in something larger than ourselves.”
— Johnathan Haidt, “The Righteous Mind.”
This is an interesting quote from “The Righteous Mind” (Haidt 2012). Humans are programmed to participate in groups. Some people buy tickets because they are lonely or bored. If these mechanisms, such as the “need to belong” drive some sports fandom, they may be manipulated. Maybe they are being manipulated. Ultimately, there are many reasons why someone might buy tickets to a sporting event:
- They buy them for their business
- They want something to do
- They have brand loyalty driven by upbringing
- They are motivated to associate themselves with a winning group
- They genuinely like and appreciate the sport
- They feel good when they come to a game
- They want something to do with their family
There are also brand components associated with history and logos. This one is interesting. Recently, some teams have abandoned logos and nicknames in response to societal or corporate pressure. 20 What does this mean in an analytics context? How much is a brand worth? First, brand equity must be pondered. This is at least partially what drives corporate sponsorship. Borrowed equity by associating your brand with another brand with a positive image is fundamental to a significant revenue driver for clubs. Brand value might be calculated using techniques such as the Royalty Relief Method. 21 The main idea is that brands have tremendous value.
There could be many answers to why someone might purchase tickets to a baseball, football, basketball, hockey, or soccer game. People in the United States and worldwide have complex emotional relationships with sports and brands. These emotions better explain their behavior than a model predicting the likelihood to purchase.
This side of sports marketing is often overlooked and under-served. Behavioral economics is a vast field. At least one technique we use later in the book has some of its roots in behavioral economics, and there is much literature on these subjects. “The Power of Moments” (Chip Heath 2017) is an outstanding book that is imminently useful if one is to consider how specific mechanisms engender loyalty. Central themes such as pride and connection are almost instantly accessible to marketers at the club level. How can an analyst help drive the desired outcomes? The answer may depend on solutions outside the wheelhouse of a data scientist or business analyst.
1.5 Key concepts and chapter summary
This chapter explains some rationale for approaching analytics and strategy at an organizational level. Strategy is a broad term and could include many elements, such as business development and hedging strategies. We focused on analytics strategy and covered a few main points related to our analytics hierarchy:
- Technology’s integral relationship to analytics
- Basic SQL data structures and the importance of data integrity
- Business Intelligence
- Analytics
- Automation and Integration
- Key performance indicators
- Behavioral economics
Ultimately, this chapter only serves to give a very high-level overview of your potential musings on analytics and business strategy:
- Technology isn’t analytics. It is a tool that serves it and other business functions. So don’t consider technology in a vacuum.
- You now understand some basics about data structure and databases. Without good data, your project is going nowhere. You’ll want to acquire some knowledge of SQL, or you will be limited in your capability.
- Business Intelligence tends to focus on reporting and research. Therefore, you’ll likely begin with descriptive reports and, as your organization matures, become more forward-looking by incorporating analytics functions.
- Analytics mainly focuses on trying to guess future outcomes. There are a variety of regression and machine-learning tools at your disposal. These tools have been commoditized over the past couple of decades. This world is much easier to navigate than ten years ago.
- Automating tasks is a force multiplier. There is currently an arms race going on between big-tech companies as they continue to bolster their analytics and database systems. The Google Cloud Platform and Amazon Web Services are two key examples. They have hundreds of tools between them for consuming, manipulating, and deploying data.
- The most challenging part of determining KPIs is agreeing on the metric. Some KPIs are easy. For instance, NOI or revenue-per-square-foot might be great KPIs when dealing with real estate. KPIs are contextual.
- People do things for different reasons. Modeling consumer behavior is complex but plays a significant role in sports. We only touched on Behavioral Economics, but rounding out your analytics toolbox with some reading in this field is highly recommended.